
Analytics
HometownLive includes built-in analytics covering visitors, pages, events, videos, and live channels. Use these reports to understand viewership trends, identify your most popular content, and measure platform performance over time. All analytics pages share a consistent set of time-range filters and export controls.
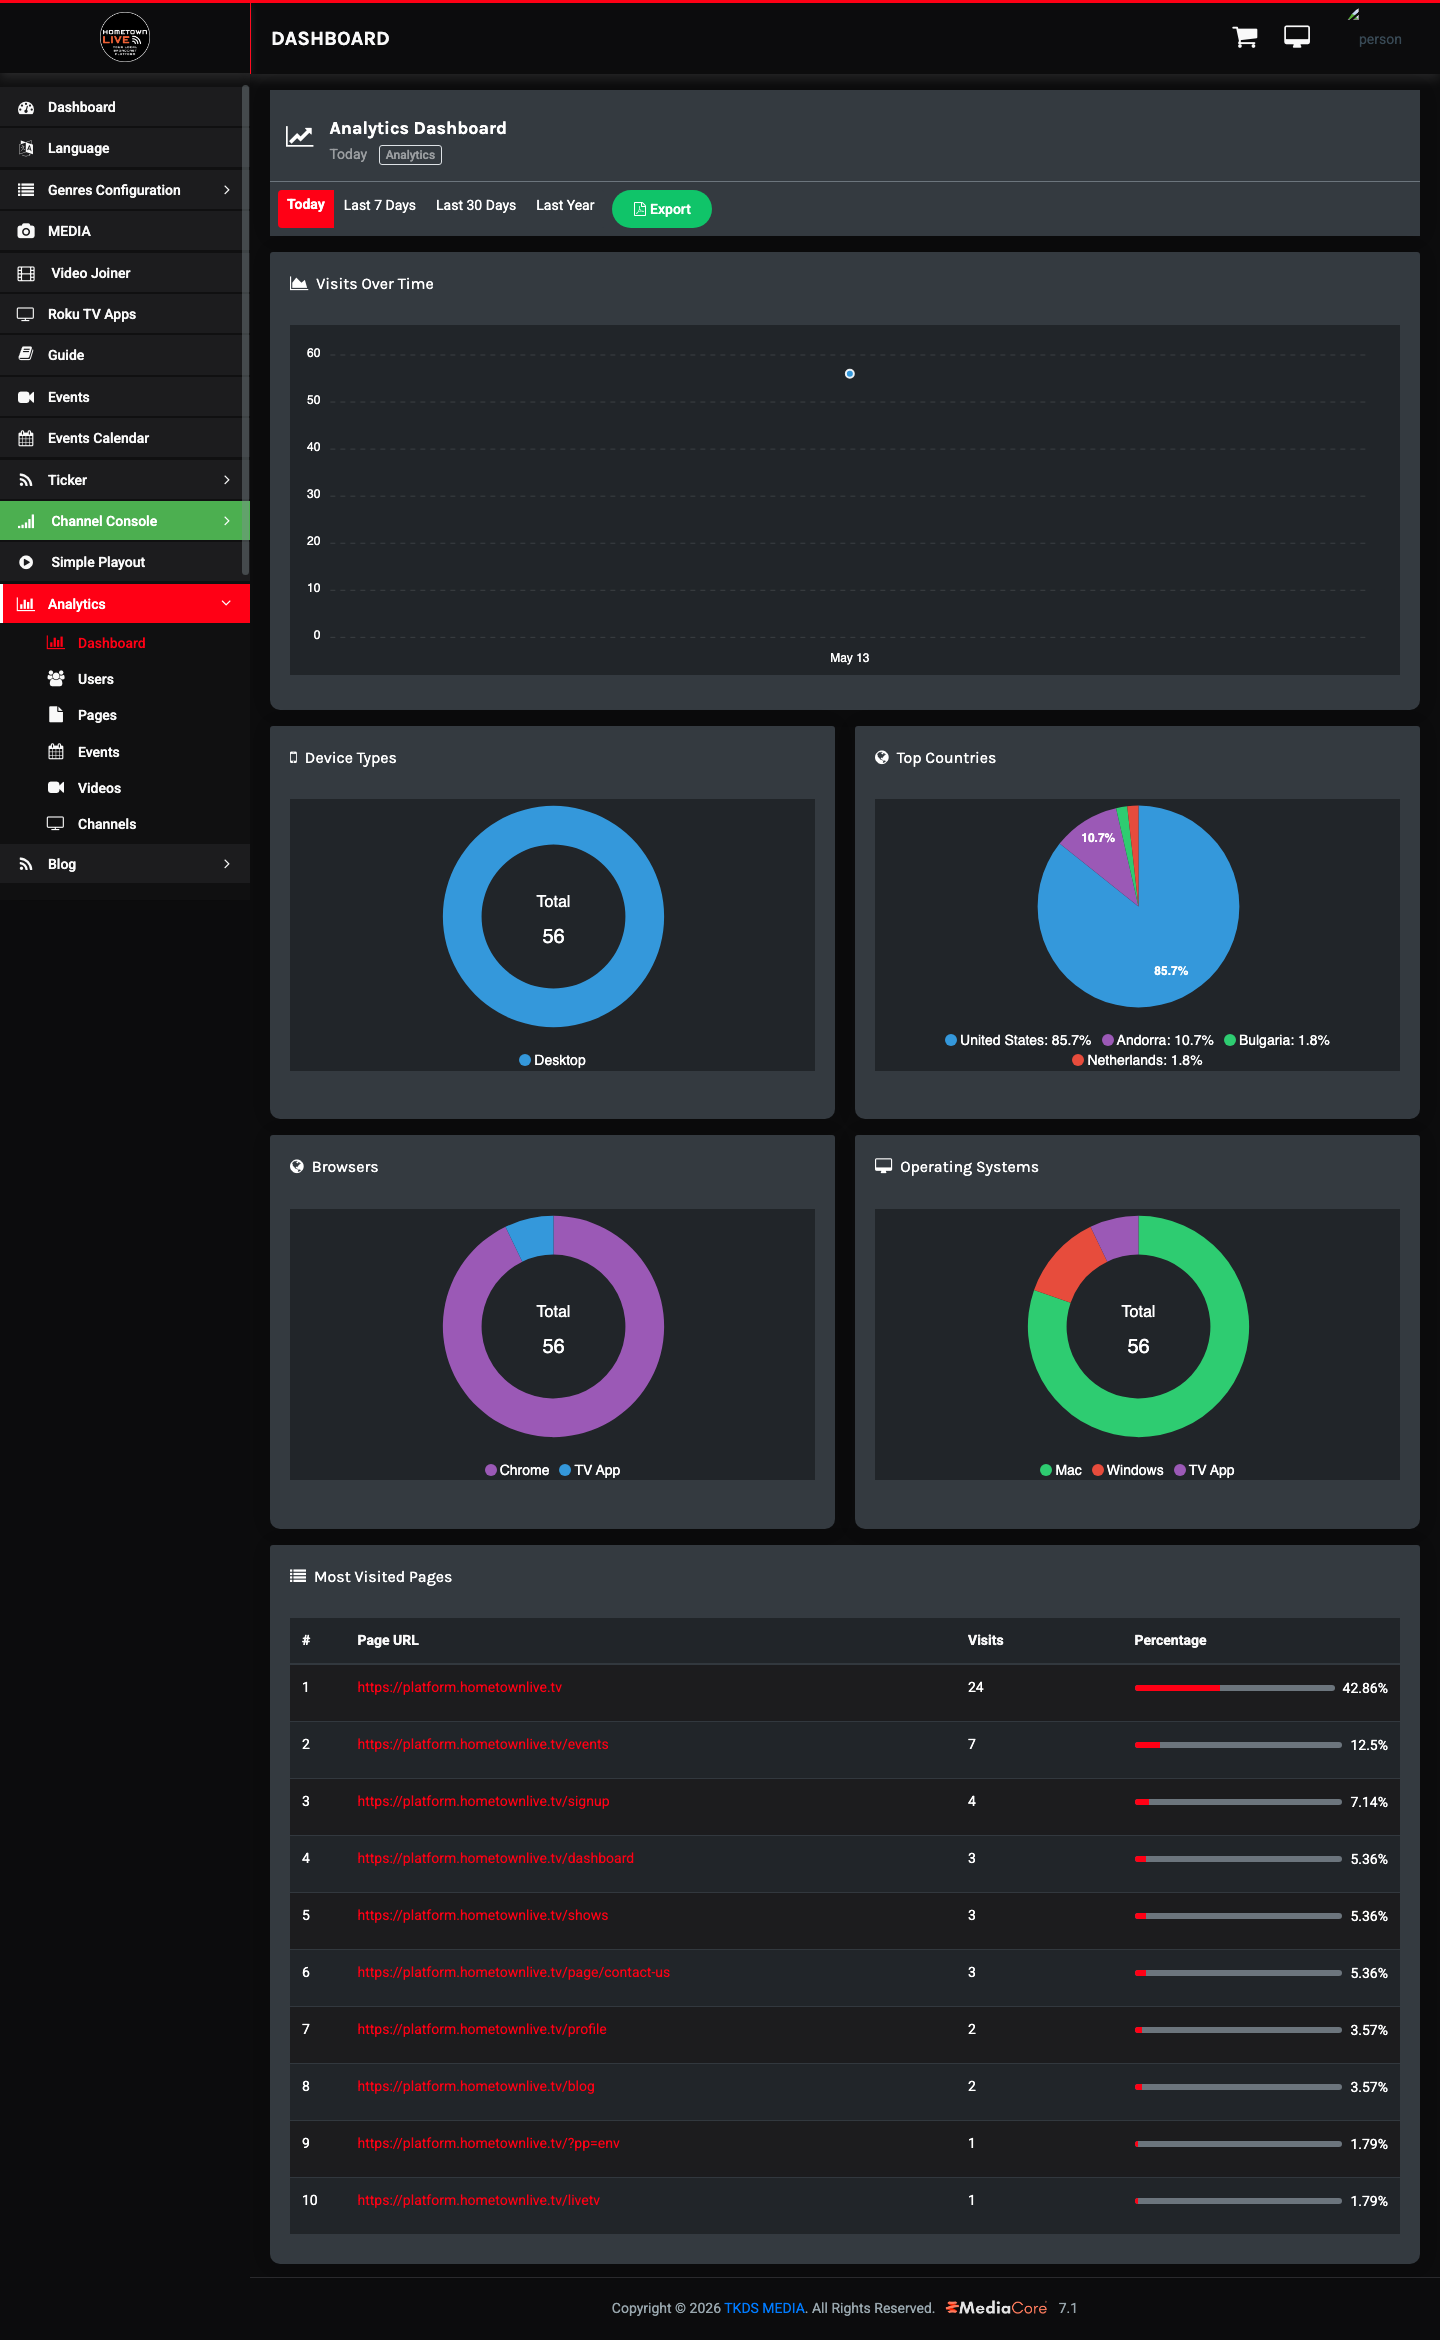
Analytics Dashboard
Location: Sidebar → Analytics (/admin/analytics)
The Analytics dashboard provides a high-level overview of all platform traffic. It is the best starting point for a quick health check on viewership before drilling into specific sub-reports.
Time Range Controls
Select a reporting period using the buttons at the top of the page:
| Button | Period Covered |
|---|---|
| Today | The current calendar day from midnight to now. |
| Last 7 Days | The previous seven days, including today. |
| Last 30 Days | The previous thirty days, including today. |
| Last Year | The previous twelve months, including the current month. |
Click Export to download the current dashboard view as a CSV file.
Dashboard Widgets
The dashboard displays six widgets that update based on the selected time range.
| Widget | Chart Type | What It Shows |
|---|---|---|
| Visits Over Time | Line chart | Total site visits plotted across the selected period. Use this to identify traffic spikes tied to live events. |
| Device Types | Donut chart | Proportion of visits from Desktop, TV App, and other device types. Use this to understand how viewers are watching. |
| Top Countries | Pie chart with percentages | Countries generating the most traffic, ranked by share of total visits. |
| Browsers | Breakdown chart | Browser distribution among all visitors. |
| Operating Systems | Breakdown chart | OS distribution among all visitors. |
| Most Visited Pages | Table (10 rows) | Top 10 pages ranked by visits, showing Page URL, Visits, and Percentage of total. |
Tip: Use the Visits Over Time chart to correlate traffic peaks with specific events. A sharp spike on a date typically indicates a popular live event drove viewers to the platform.
User Analytics
Location: Sidebar → Analytics → Users (/admin/analytics/users)
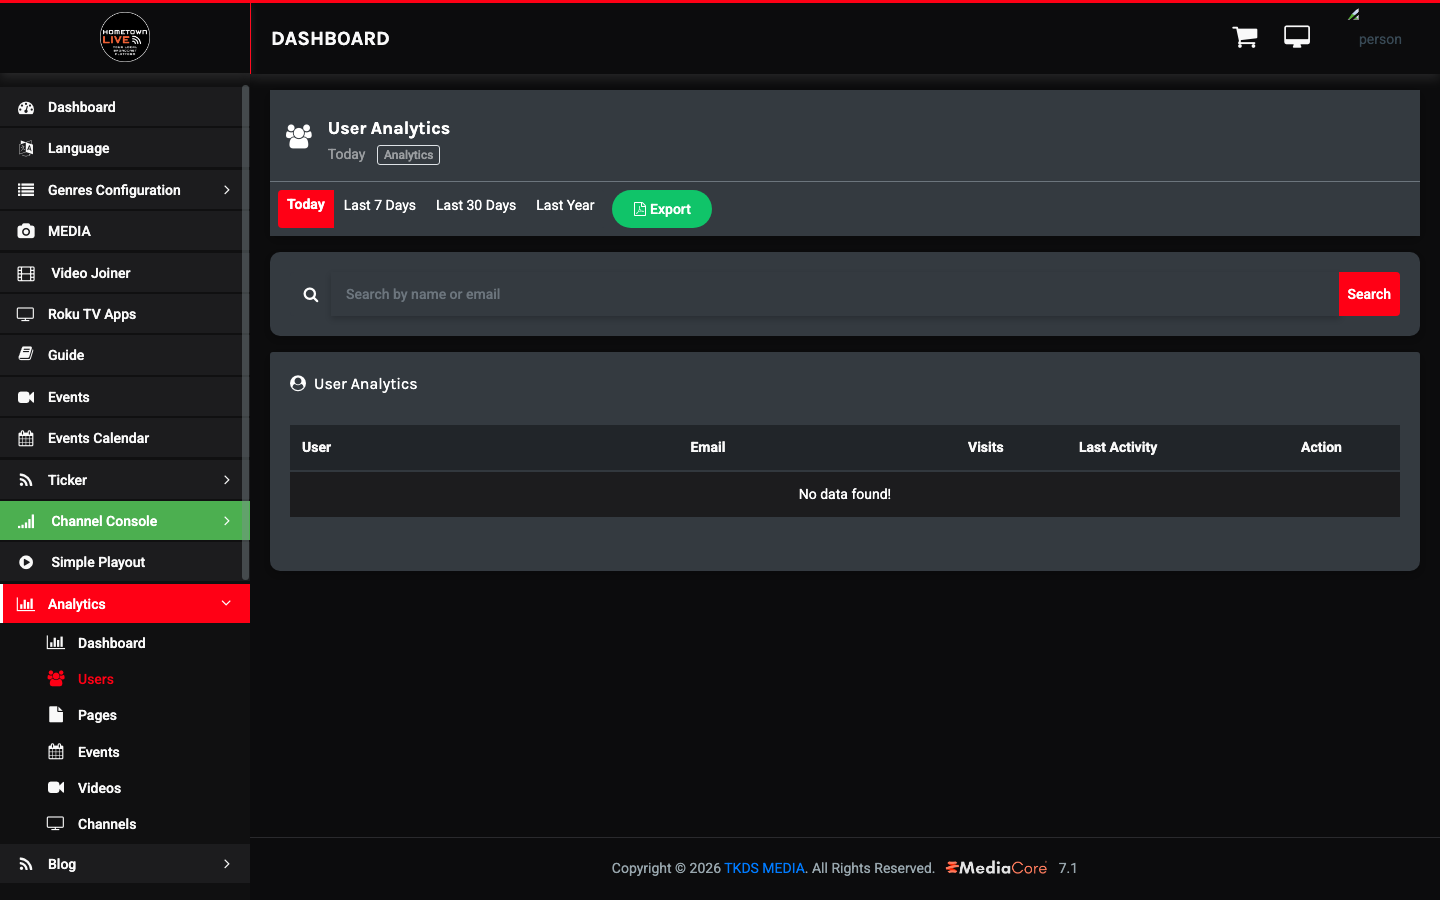
User Analytics tracks visit activity at the individual account level. Use this report to identify your most engaged viewers, recognize inactive accounts, or investigate unusual activity patterns.
Using User Analytics
- Select a time range using the buttons at the top of the page.
- Use the Search field to find a specific user by name or email.
- Click Export to download the complete filtered list as a CSV file.
User Analytics Table Columns
| Column | Description |
|---|---|
| User | The viewer's display name. |
| The account email address associated with this user. | |
| Visits | Total page visits by this user in the selected time period. |
| Last Activity | The date and time of this user's most recent visit. |
| Action | Links to the user's full account record. |
Note: User Analytics tracks page visits tied to logged-in accounts. Anonymous visitors are counted in the main Analytics dashboard but do not appear in the User Analytics table.
Page Analytics
Location: Sidebar → Analytics → Pages (/admin/analytics/pages)
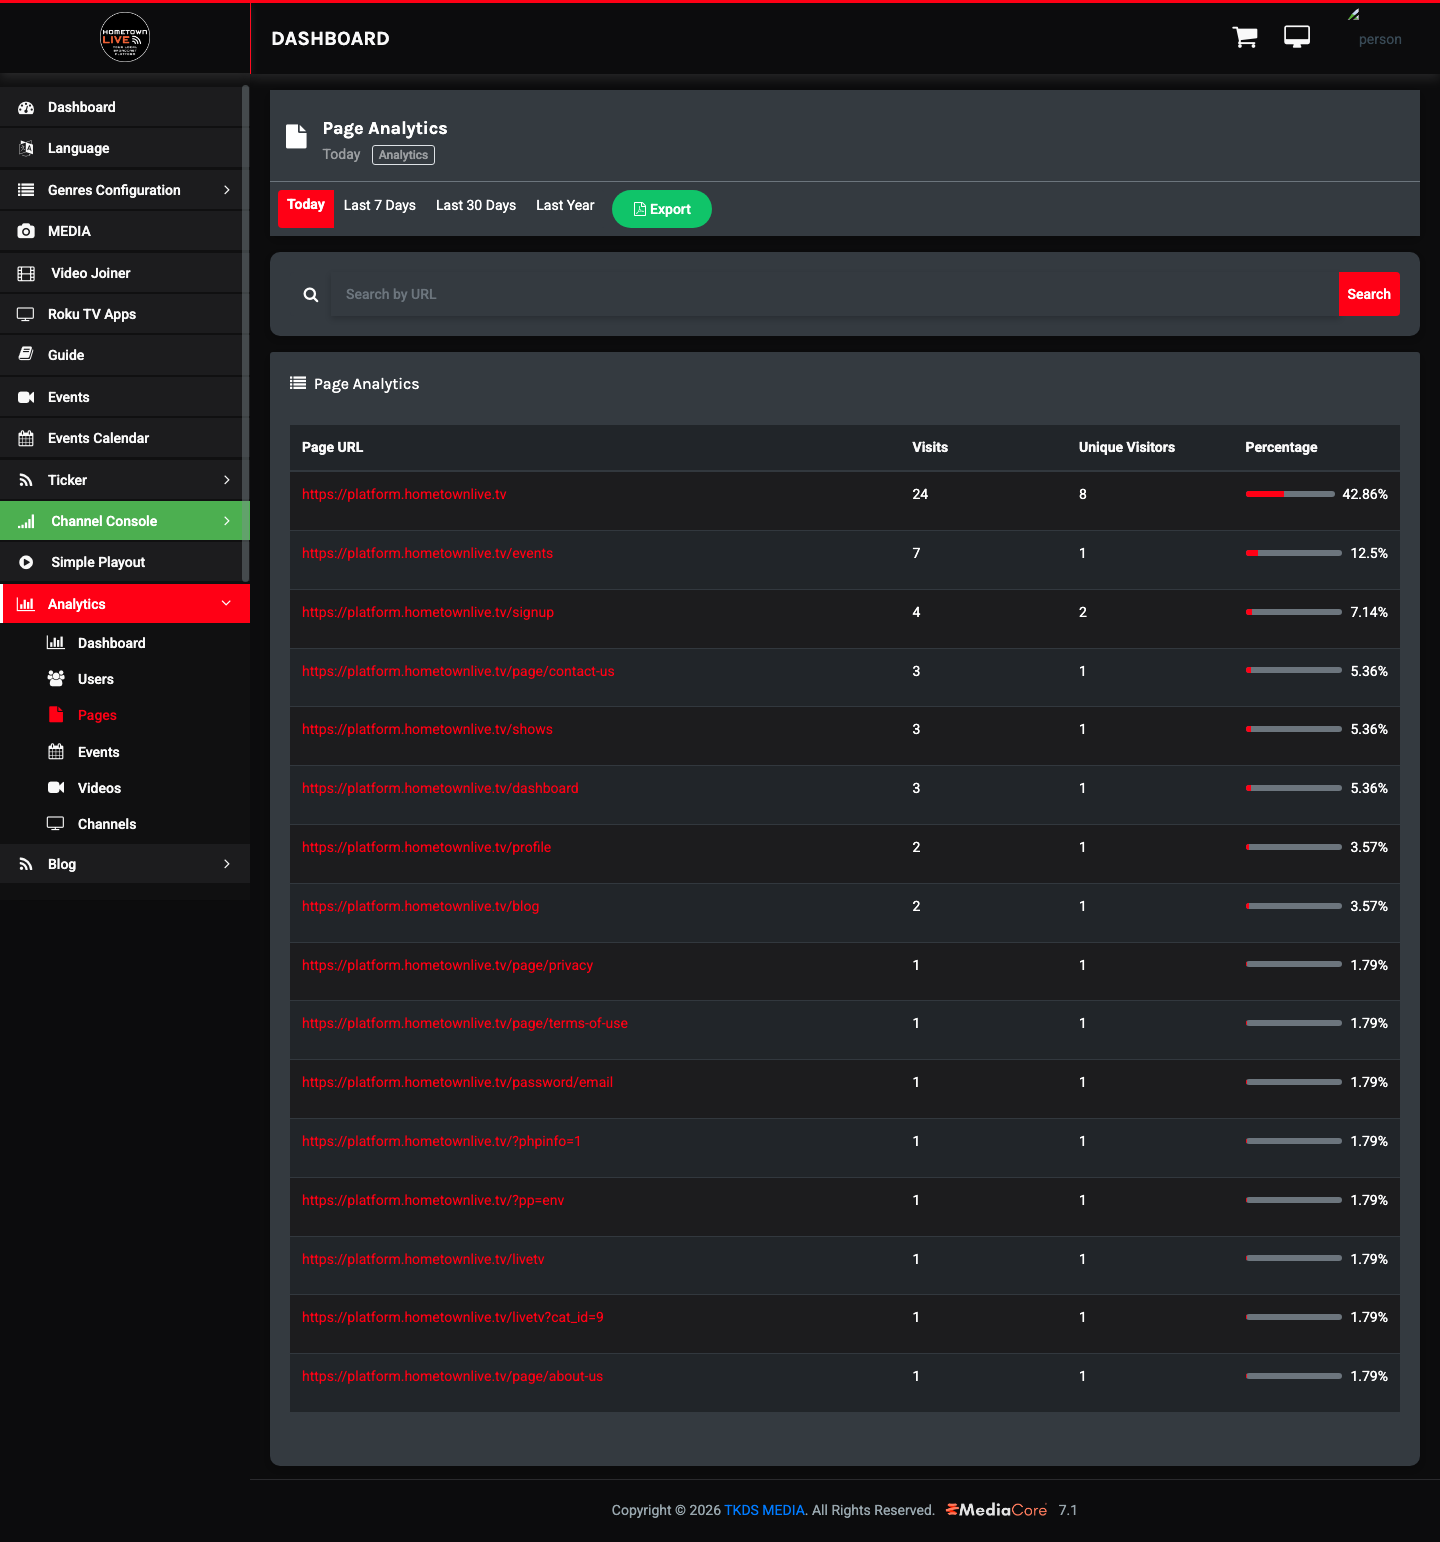
Page Analytics shows which pages on the platform receive the most traffic. Use this data to understand which content surfaces are driving viewer engagement and which pages may need improvement.
Using Page Analytics
- Select a time range.
- Use Search to filter results by URL.
- Click Export to download the data as a CSV.
Page Analytics Table Columns
| Column | Description |
|---|---|
| Page URL | The path of the page relative to the platform root. |
| Visits | Total visits to this page in the selected time period. |
| Unique Visitors | Count of distinct visitors who loaded this page at least once. |
| Percentage | This page's share of total platform traffic. |
Example data from a typical installation:
| Page URL | Visits | Percentage |
|---|---|---|
| / (homepage) | 55 | 36.67% |
| /events | 10 | 6.67% |
| /signup | 10 | 6.67% |
| /blog | 10 | 6.67% |
Tip: A high percentage of traffic on
/signuprelative to the homepage can indicate strong conversion intent. Pair this with the subscription transaction data in the Monetization section to measure actual conversion.
Events Analytics
Location: Sidebar → Analytics → Events (/admin/analytics/events)
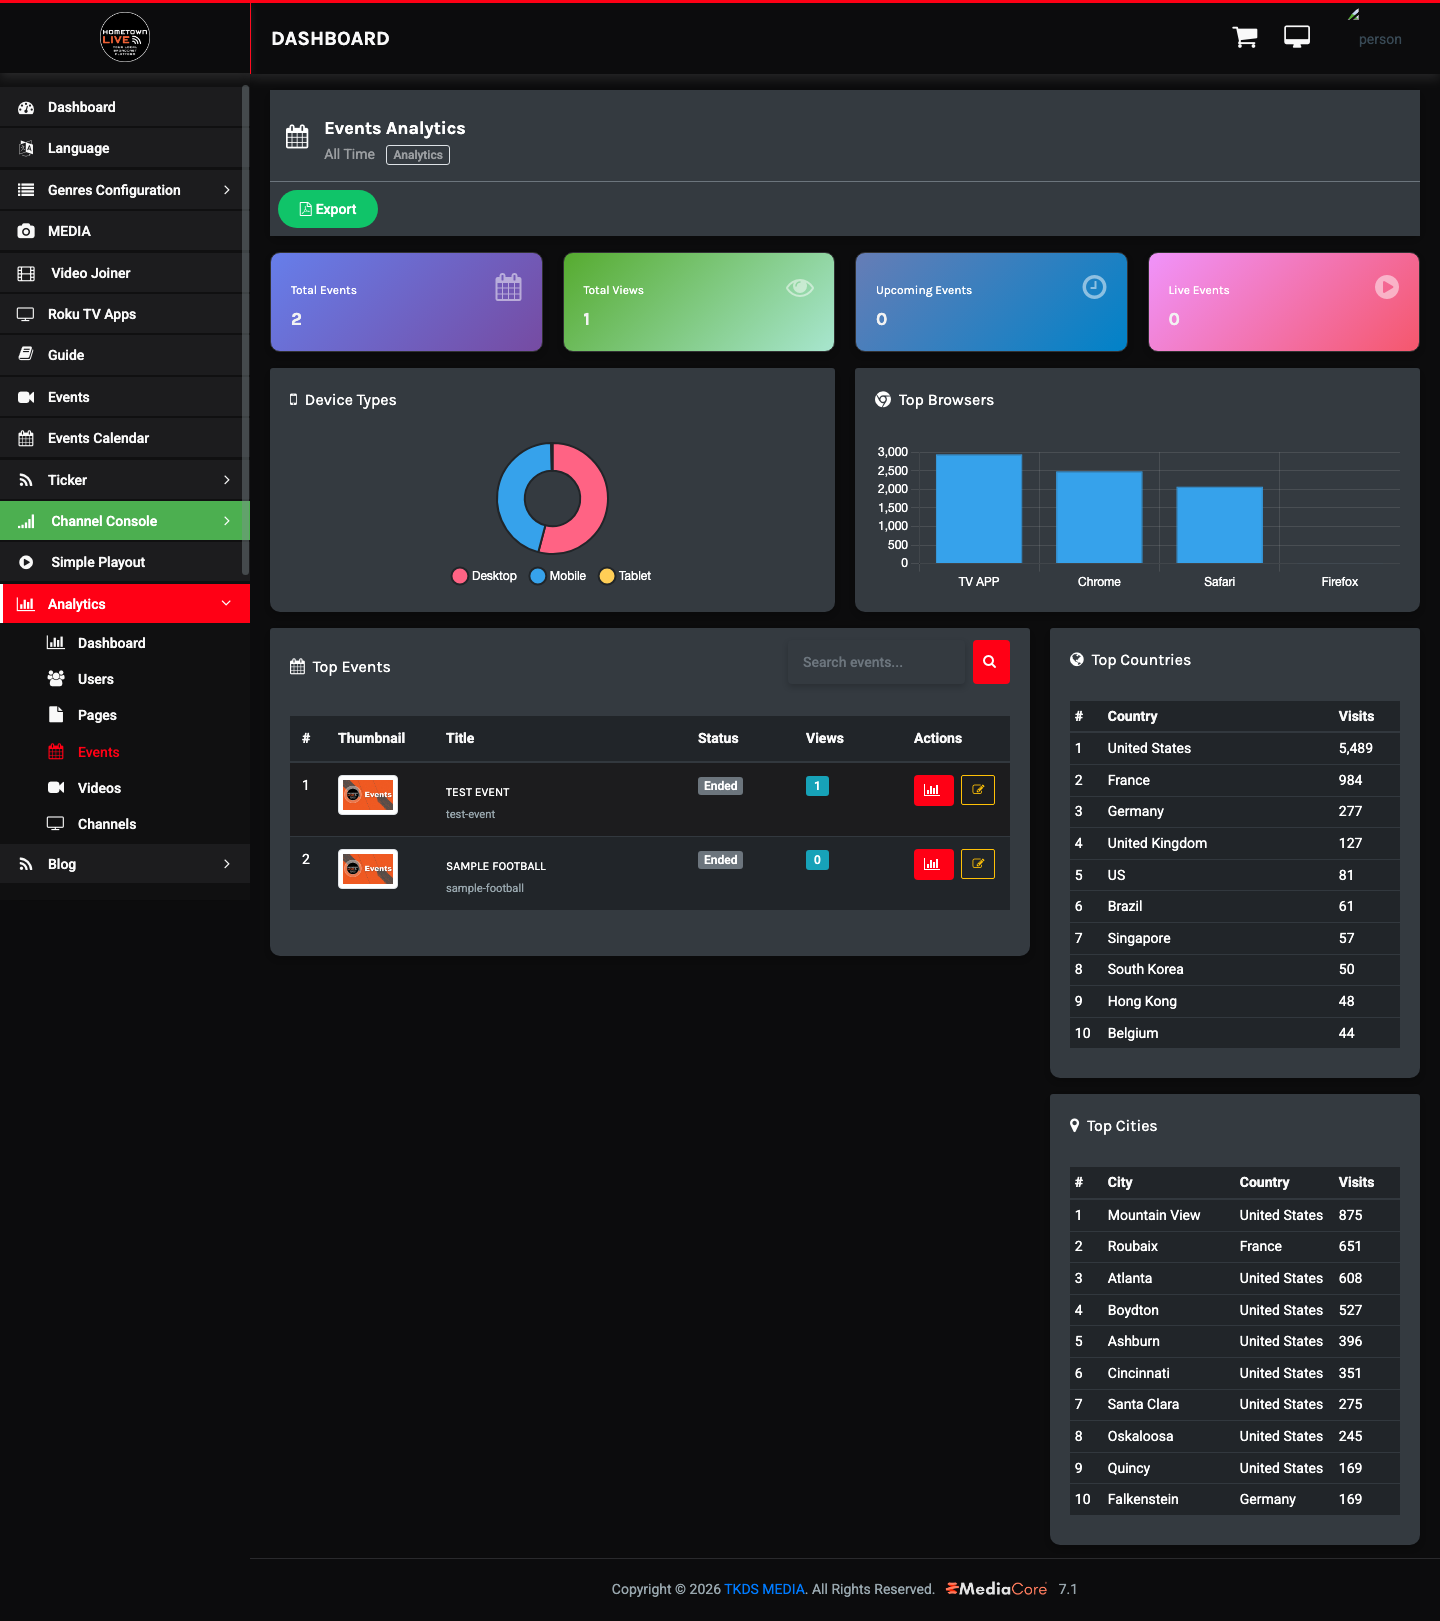
Events Analytics measures the performance of live and on-demand events. Use it to identify your highest-performing events, understand where your event audience is located, and track viewership trends across your schedule.
Summary Tiles
Four summary tiles appear at the top of the page to provide a quick snapshot.
| Tile | What It Shows |
|---|---|
| Total Events | Count of all events currently in the system. |
| Total Views | Cumulative view count across all events. |
| Upcoming Events | Count of events scheduled in the future. |
| Live Events | Count of events currently streaming. |
Events Analytics Charts
Two charts appear below the summary tiles:
- Device Types — proportion of event views from Desktop, TV App, and other devices.
- Top Browsers — browser distribution for event viewers specifically.
Top Events Table
The Top Events table shows the best-performing events ranked by views.
| Column | Description |
|---|---|
| # | Rank by view count. |
| Thumbnail | Event thumbnail image. |
| Title | Event name. |
| Status | Whether the event is Active, Upcoming, or ended. |
| Views | Total view count for this event. |
| Actions | Link to edit the event or view detailed analytics. |
Geographic Tables
Below the Top Events table, two geographic breakdowns help you understand where your audience is located.
Top Countries table — shows the top countries by visit count:
| Country | Example Visits |
|---|---|
| United States | 5,489 |
| France | 984 |
| Germany | 277 |
Top Cities table — shows the top cities with country and visit count:
| City | Country | Example Visits |
|---|---|---|
| Mountain View | US | 875 |
| Roubaix | France | 651 |
| Atlanta | US | 608 |
Note: Geographic data is derived from IP address geolocation. City-level data is approximate and may not be accurate for all visitors, particularly those using VPNs or cellular data.
Video Analytics
Location: Sidebar → Analytics → Videos (/admin/analytics/videos)
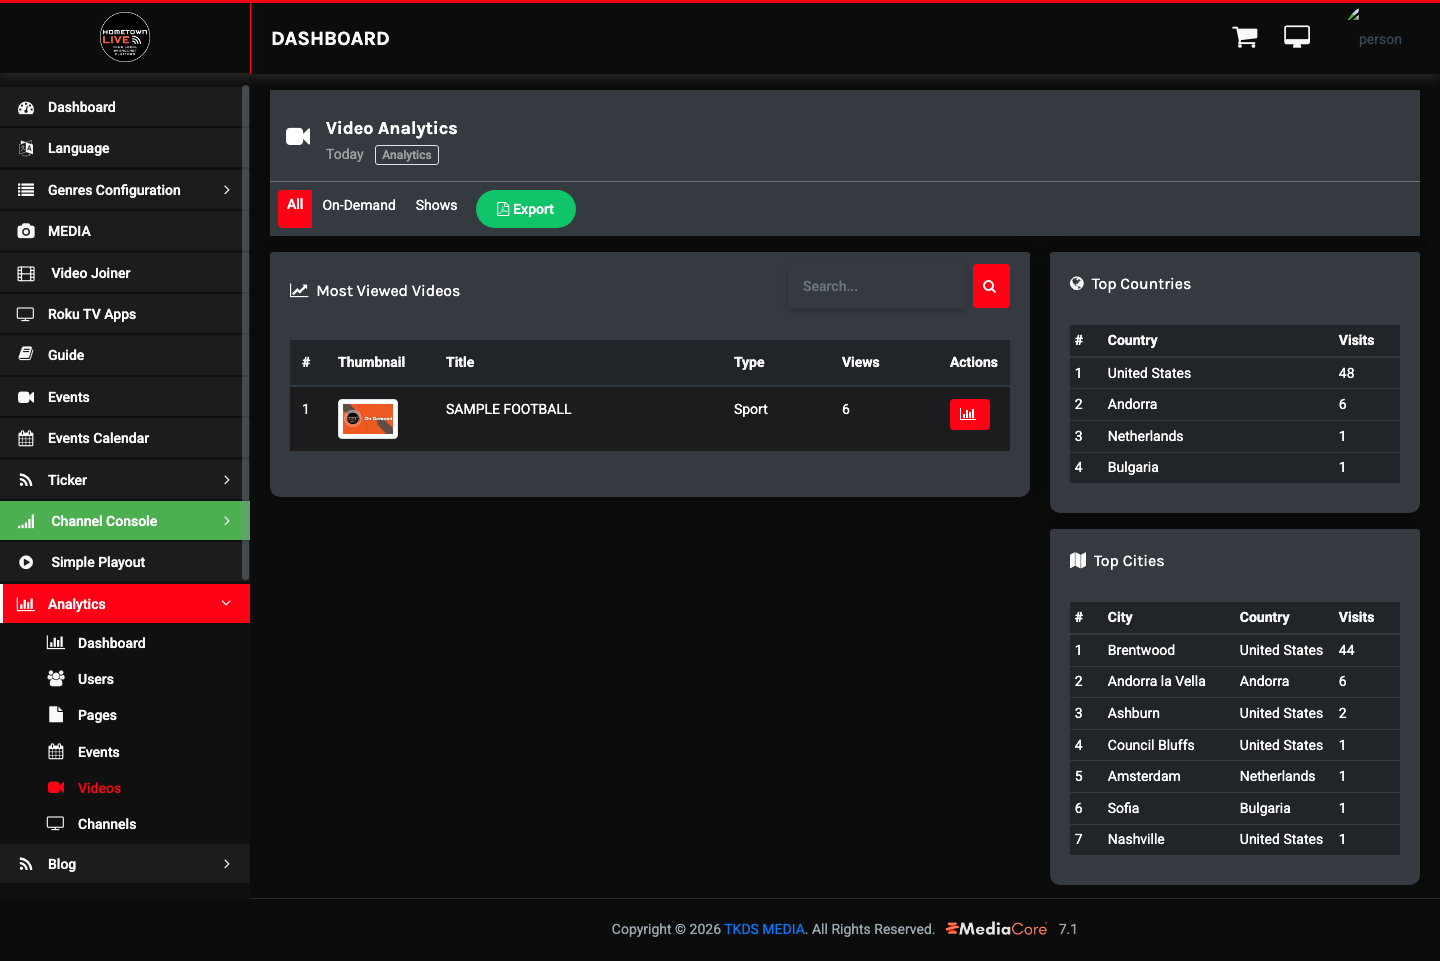
Video Analytics measures the performance of on-demand video content, including standalone videos and TV Show episodes. Use it to identify which on-demand content is resonating with viewers and prioritize similar content production.
Content Type Filter
Use the filter tabs to narrow the view to a specific content type:
- All — on-demand videos and show episodes combined.
- On-Demand — standalone on-demand video items only.
- Shows — TV Show episodes only.
Most Viewed Videos Table
| Column | Description |
|---|---|
| # | Rank by view count. |
| Thumbnail | Video thumbnail image. |
| Title | Video title. |
| Type | On-Demand or Show. |
| Views | Total view count. |
| Actions | Link to edit the video or view details. |
The Top Countries and Top Cities geographic tables appear below the main videos table, using the same format as the Events Analytics geographic tables.
Tip: Compare performance across On-Demand and Shows separately to identify which format drives more engagement for your audience.
Channel Analytics
Location: Sidebar → Analytics → Channels (/admin/analytics/channels)
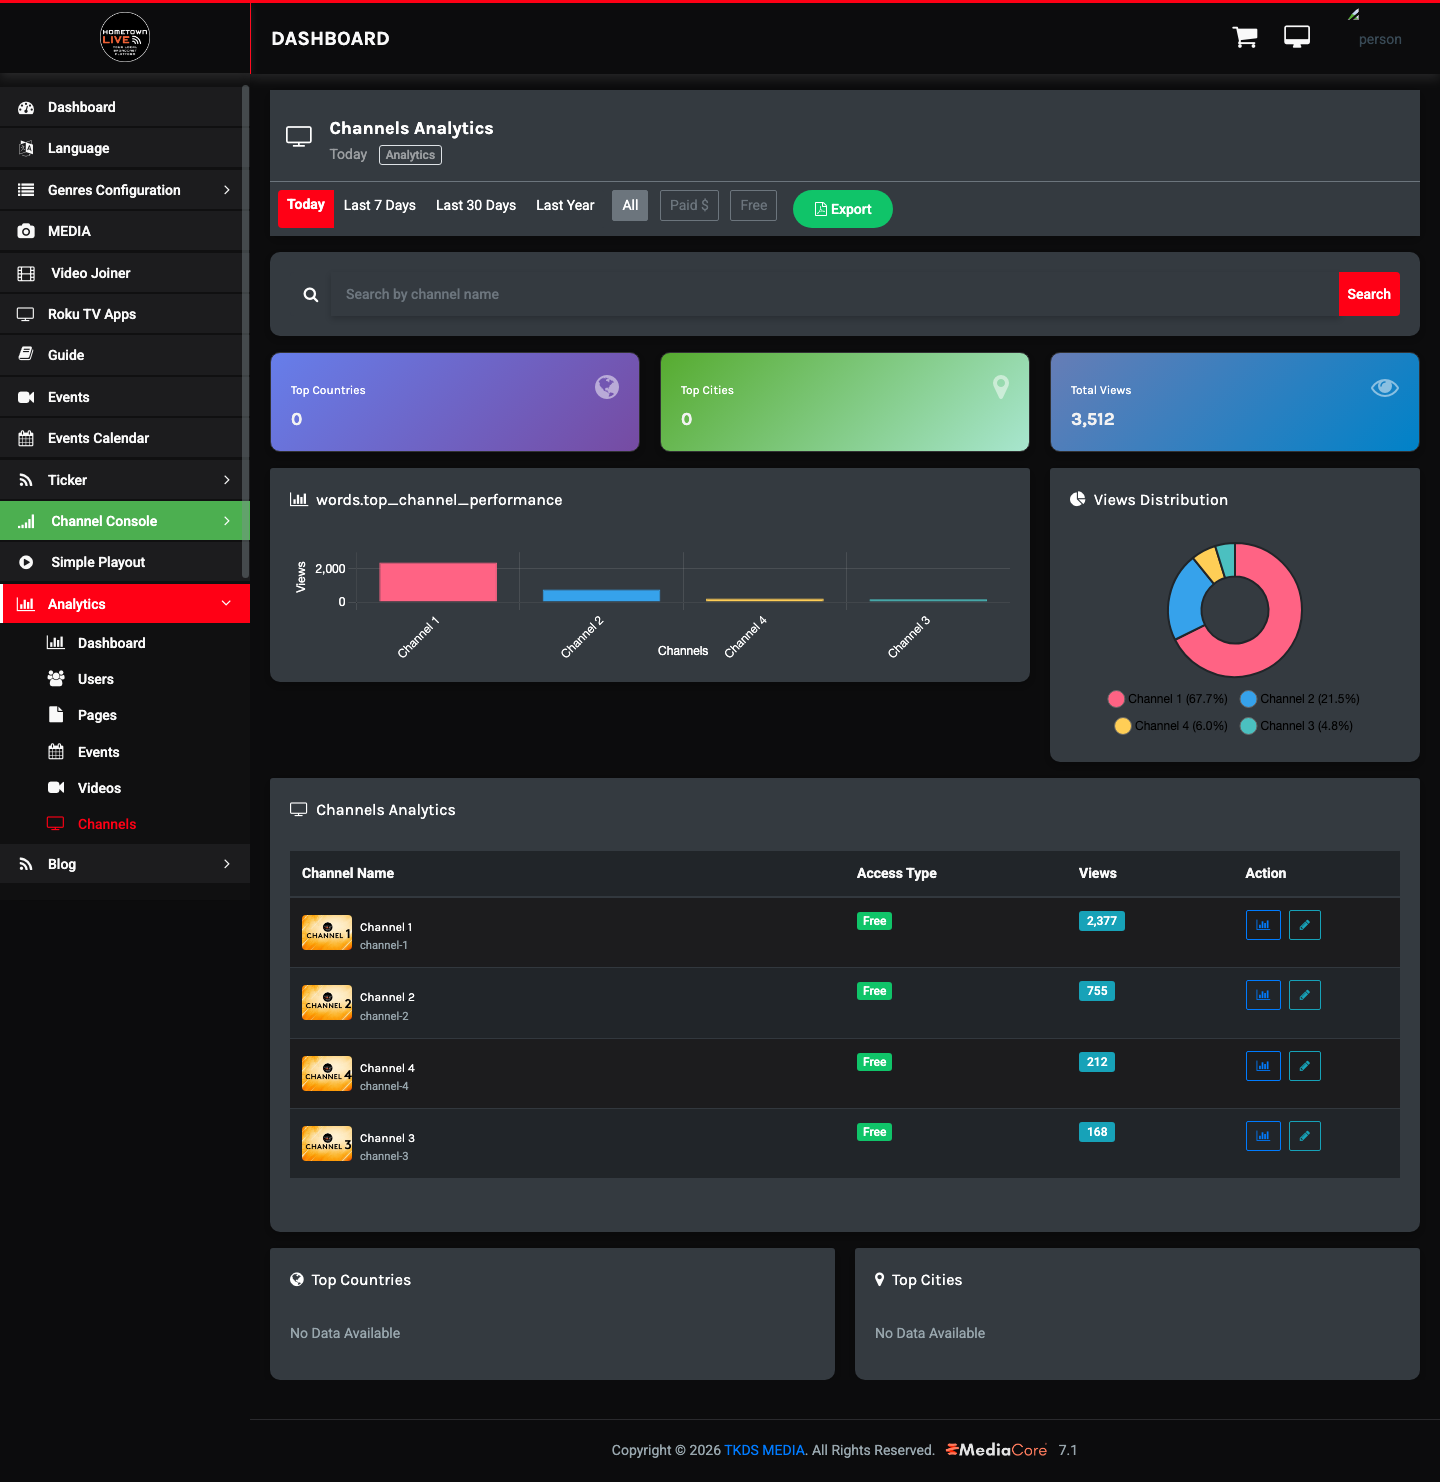
Channel Analytics reports on live channel viewership. Use it to understand which channels attract the most viewers and to compare performance between paid and free channels.
Time Range and Access Type Filters
Select a time range using the standard buttons at the top of the page. Use the access type filter tabs to segment the data:
- All — all channels regardless of access type.
- Paid — channels restricted to paid subscribers.
- Free — channels available to all visitors.
Summary Tiles
| Tile | What It Shows |
|---|---|
| Top Countries | Count of distinct countries with viewership data. |
| Top Cities | Count of distinct cities with viewership data. |
| Total Views | Cumulative view count across all channels in the selected time range. |
Channel Analytics Table
| Column | Description |
|---|---|
| Channel Name | The name of the live channel. |
| Access Type | Free or Paid. |
| Views | Total views for this channel in the selected time range. |
| Action | Link to channel details or edit screen. |
Example channel data from a typical installation:
| Channel | Access | Views |
|---|---|---|
| Channel 1 | Free | 2,377 |
| Channel 2 | Free | 755 |
| Channel 4 | Free | 212 |
| Channel 3 | Free | 168 |
The Top Countries and Top Cities geographic tables appear below the channel table, in the same format as the Events Analytics geographic breakdowns.
Tip: Use the Export button on each analytics page to download a CSV of the current view for reporting, board presentations, or sponsor performance reports.
Still need help?
Can't find what you're looking for? Our support team is here to help.
Contact Support →